Disclosure Based on TCFD Recommendations
Governance
The Sustainability Committee, which is under the direct control of the Management Council, formulates action plans addressing our Company's environmental issues and monitors the progress.
The Sustainability Committee is chaired by the Senior Executive Managing Officer, General Manager of Corporate Management Headquarters, with Full-time Corporate Auditor always present on said Committee. A system is in place to ensure appropriate supervision by the Board of Directors, in which matters discussed at the Committee are decided and approved by the Management Council and are regularly reported to the Board of Directors.
In fiscal 2025, the committee held 11 meetings, submitted proposals and reports to the Management Committee 10 times, and reported to the Board of Directors/Board of Directors briefings 6 times.
Strategy
With reference to several existing scenarios published by the International Energy Agency (IEA) and the Intergovernmental Panel on Climate Change (IPCC) at the Sustainability Committee, we envision the 2℃ and 4℃ scenarios that are the goals of the Paris Agreement, and we analyze the impact on our business and finances and consider countermeasures.
The identified risks and opportunities will be reflected management strategies, and we regularly analyze and review on a regular basis in response to changes in the environment.
Existing scenarios referenced
| Scenario | Institution | |
|---|---|---|
| 4℃ scenario |
RCP8.5 Representative Concentration Pathways 8.5 |
IPCC1 |
| 1.5℃ scenario |
SDS Sustainable Development Scenario |
IEA2 |
|
NZE2050 Net Zero Emissions by 2050 Scenario |
- 1: Intergovernmental Panel on Climate Change
- 2: International Energy Agency
Identified climate-related risks / opportunities and their impact on our business and finances
Qualitative impact on the finance
| Major classification | Category | Classification | Driver | Impact on business | Qualitative information | Impact level | |
|---|---|---|---|---|---|---|---|
| 4℃ | 1.5℃ | ||||||
| Risks | Transition risks | Development of policies / laws | Introduction of carbon price | Increase in operating costs and procurement costs due to the introduction of carbon tax, etc. | Increase in the operational costs, such as carbon taxes, due to the introduction of policies / laws and regulations to reduce greenhouse gas emissions. Increase in the procurement cost due to the increase also in the supply chain's operating costs | Low | Medium |
| Changes in the energy mix | Changes in the electricity rates and increase in production costs due to an increase in the proportion of power generation using equipment with low emission factors (renewable energy / new energy / next-generation energy) | Increase in the operating cost due to increase in the electricity price. Increase in the procurement cost due to increase also in the supply chain's operation cost | Medium | Medium | |||
| Mandatory disclosure of environmental indicators | Increase in operational cost due to expanded mandatory disclosure of environment-related indicators such as GHG emissions | Increase in the operational cost that corresponds to the disclosure obligations. Risks of penalties and decline in corporate reputation due to inadequate response to disclosure | Low | Medium | |||
| Strengthening of plastic regulations | Increase in the costs due to re-evaluation of packaging materials, logistics materials, and products / accessories | Due to the strengthened plastic regulations, costs may increase due to our re-evaluation of materials, but the impact is expected to be minor as we are proactively responding to it. | Low | Medium | |||
| Technologies | Development of new technologies with low impact on the environment | Increase in the procurement cost due to our response to the new technology | Increase in the procurement cost due to the spread of new materials and technologies with low impact on the environment, such as recycled fibers, and our company being asked to respond accordingly. Although some brands have already incorporated sustainable materials, the impact of switching in all brands at once is high | Medium | Medium | ||
| Markets | Shrinking ready-made products / real store markets | Shrinkage of ready-made product sales and physical store sales due to changes in consumers | A certain degree of market change is already underway, including the shrinkage of the ready-made clothing market due to changes in consumer awareness, the shrinkage of physical store sales due to changes in [consumer] behavior, and the Covid-19 pandemic | Medium | Medium | ||
| Reputation | Increase in ESG investors | Investment withdrawal / reduction of investment amounts due to lack of ESG initiatives | The risk of investors withdrawing increases due to our delays in responding to environment-friendly products / services. Funding may also be affected | Low | Medium | ||
| Reputation among customers and in the society | Increase in costs in order to respond to the corporate stance and product reputation due to the spread of SNS and increased environmental awareness among consumers | Increase in the manufacturing costs due to expanded use of sustainable materials, strengthened factory audits, etc. In parallel with the expansion of corporate initiatives, there is a need for greater information disclosure than ever before | Low | Medium | |||
| Physical risks | Acute [risks] | Increased severity and frequency of natural disasters such as typhoons and floods (heavy rains / typhoons / floods / water shortages, etc.) | Increase in the number of store closures due to natural disasters, and increase in suspended / reduced operation due to damage caused to production and logistics facilities | Increase in the damage to stores and number of closed days due to increased natural disasters caused by climate change and increased risk of infectious diseases. Caused by decrease in sales and increase in repair costs | High | Low | |
| Chronic [risks] | Rise in the average air temperature, seawater temperature, and sea level | Loss of in-store sales opportunities due to increased disease risks (heatstroke, infectious diseases, etc.) and loss of heavy clothing sales opportunities due to the rising temperatures | As temperatures rise, sales opportunities for our main sales channels and main products (outerwear) shrink, and our profits are lower due to lower profit margins | High | Medium | ||
| Opportunities | Opportunities | Resource efficiency | Improvement of efficiency in production and distribution processes | Development of cyclic products through the spread of recycling technologies and waste reduction by expanding secondary distribution channels | Decrease in the procurement cost for recyclable products, which are expected to be sought after as technologies spread. There are opportunities, also, to improve corporate values and expand investment by condensing purchases and reducing product wastes | Medium | High |
| Products / Services | Development of new product groups and expanded sales by popularizing new functional materials and environment-friendly materials | Opportunities to expand sales by developing new product groups through popularization of low-carbon materials such as recycled materials and to develop new markets that respond to changes in consumer tastes. | Decrease in the procurement cost of recyclable products that are expected to be addressed as technologies become more widespread. There are opportunities to improve corporate values and expand investments by condensing purchases and reducing product wastes | Medium | Medium | ||
| New markets | Expansion of the sustainable brand market | Increase in sales by expanding the ECOALF business and developing sustainable products across all brands | Expansion of sales of sustainable brands with increase in consumer awareness. There are opportunities to improve profitability by restructuring the business portfolio and concentrating management resources, such as considering sublicense for ECOALF | Medium | Medium | ||
| Expansion of the summer clothing market | Expansion of the summer clothing market due to global warming and decrease in the procurement cost due to the spread of functional materials | As average temperatures rise, consumers' tastes change, and opportunities to propose new functions / designs for summer clothing increase. The procurement cost is also expected to decrease with the spread of functional materials | Medium | Low | |||
Risk Management
Through the Sustainability Committee, we regularly analyze climate-related risks, formulate action plans, and report them to the Management Meeting and the Board of Directors.
Regarding the response to physical risks (acute risks) caused by natural disasters, the Crisis Management Committee under the direct control of the Representative Director & President has established a system to carry out business continuity management such as BCP formulation.
Our risk management system

Metrics and Targets
GHG emission reduction targets
| Medium-term Targets | Long-term Targets | ||
|---|---|---|---|
| Scope1・2 | Specific reduction targets | Major reduction efforts | Scopes 1 and 2 to be net zero by 2050 |
| 52% reduction from FY2019 by FY2030 (▲1,840t-CO2) |
|
||
| Scope3 (Category1・3・4・12) |
30% reduction from FY2019 by FY2030 (▲13,620t-CO2) |
|
|
- With the approval from SBTi, we re-established our Medium-term Targets (April 2025)
GHG emissions record: changes in past record
Changes in supply chain emissions
Unit: t-CO2| Scope | Category | FY2019 | FY2020 | FY2021 | FY2022 | FY2023 | FY2024 | FY2025 |
|---|---|---|---|---|---|---|---|---|
| Scope1 | Direct GHG emissions by the business operators | 898 | 887 | 883 | 902 | 928 | 872 | 799 |
| Scope2 Location-Based Method |
Indirect emissions due to the use of electricity, heat, and/or steam | 2,879 | 2,260 | 2,003 | 1,852 | 1,844 | 1,778 | 1,765 |
| Scope2 * Market-Based Method |
Indirect emissions due to the use of electricity, heat, and/or steam | 2,640 | 2,066 | 1,628 | 1,638 | 1,574 | 1,329 | 846 |
| Scope1+2 * | Total | 3,538 | 2,954 | 2,512 | 2,540 | 2,501 | 2,202 | 1,645 |
| Scope3 | Category1 Purchased products / services |
43,291 | 28,721 | 25,300 | 28,674 | 29,322 | 30,285 | 29,669 |
| Category2 Capital goods |
7,796 | 1,912 | 538 | 1,234 | 2,117 | 1,696 | 4,497 | |
| Category3 Fuel and energy activities other than SCOPE 1.2 |
457 | 387 | 359 | 346 | 335 | 345 | 335 | |
| Category4 Transportation and delivery (upstream) |
1,156 | 792 | 694 | 749 | 734 | 787 | 754 | |
| Category5 Wastes from business offices |
29 | 23 | 23 | 26 | 27 | 21 | 17 | |
| Category6 Business trip |
495 | 456 | 368 | 343 | 338 | 337 | 325 | |
| Category7 Employer's commute |
1,318 | 1,184 | 990 | 953 | 972 | 988 | 982 | |
| Category8 Leased assets (upstream) |
0 | 0 | 0 | 0 | 0 | 0 | 0 | |
| Category9 Transportation and delivery (downstream) |
0 | 0 | 0 | 0 | 0 | 0 | 0 | |
| Category10 Processing of sold products |
0 | 0 | 0 | 0 | 0 | 0 | 0 | |
| Category11 Use of sold products |
0 | 0 | 0 | 0 | 0 | 0 | 0 | |
| Category12 Disposal of sold products |
472 | 324 | 283 | 306 | 300 | 321 | 308 | |
| Category13 Leased assets (downstream) |
0 | 0 | 0 | 0 | 0 | 0 | 0 | |
| Category14 Franchise |
0 | 0 | 0 | 0 | 0 | 0 | 0 | |
| Category15 Investment |
6,849 | 3,628 | 3,714 | 3,791 | 3,150 | 2,204 | 1,410 | |
| Total | 61,863 | 37,427 | 32,270 | 36,422 | 37,295 | 36,984 | 38,297 | |
| Category1・3・4・12 Total * Target approved by SBTi |
45,377 | 30,224 | 26,636 | 30,074 | 30,690 | 31,738 | 31,066 | |
| Grand total | 65,400 | 40,380 | 34,781 | 38,962 | 39,796 | 39,186 | 39,942 | |
| YoY | - | 62% | 86% | 112% | 102% | 98% | 100% | |
| Scope1+2 | Compared to FY2019 | Base year | 83% | 71% | 72% | 71% | 62% | 46% |
| Scope3 | 60% | 52% | 59% | 60% | 60% | 62% | ||
| Scope3 (Category1・3・4・12) * Target approved by SBTi |
67% | 59% | 66% | 68% | 70% | 68% | ||
- FY2025 actual figures are forecast values
- As approved by SBTi, we have revised some data beyond the base year (April 2025)
Sanyo Sewing Co., Ltd., a non-consolidated subsidiary, was added to Scope1,2. (moved from Scope3 category 15)
Scope3 Category8: Not applicable because it is included in Scope1,2
Scope3 Category9, 10, 13, 14: Not applicable due to lack of applicable data
Scope3 Category11: Excluded from calculation
Excludes emissions of 5% or less in Scope3
・Category1: Minute emissions other than products (Sanyo Shokai)
・Category5,7: Emissions from subsidiaries (SHANGHAI SANYO FASHION INC)
・Category 1, 3, 4, 5, 6, 7, and 12: Emissions from non-consolidated subsidiaries (Sanyo Sewing) - The energy consumption of some facilities has been revised to a final figure, non-fossil fuel certificates have been reflected, and the final GHG emissions figures for fiscal 2024 have been disclosed (August 2025)
GHG emissions results: method of calculating supply chain emissions
Reference: FY2025 forecast
| Scope | Category | Type | Primary unit | Actual use | Unit | CO2 emission volume (t-CO2) |
Remarks |
|---|---|---|---|---|---|---|---|
| Scope1 | Direct GHG emissions by the business operators | City gas | Per fuel usage 2.050 t-CO2/K m3 |
127 | K m3 | 261 | *1 |
| LPG | Per fuel usage 2.990 t-CO2/t |
24 | t | 71 | *1 | ||
| Kerosene | Per fuel usage 2.500 t-CO2/kl |
4 | kl | 10 | *1 | ||
| Gasoline | Per fuel usage 2.290 t-CO2/kl |
9 | kl | 20 | *1 | ||
| A Heavy oil | Per fuel usage 2.750 t-CO2/kl |
159 | kl | 437 | *1 | ||
| Scope2 Market-Based Method |
Indirect emissions from the use of electricity, heat, and/or steam supplied by other companies | Electric (Domestic) | Emission factors by electric utility (for calculating GHG emissions by specified emitters)-for R8 annual reporting | 4,129 | MWh | 828 | *1 |
| Electric (China) | Per electric power consumption 0.650 t-CO2e/MWh |
5 | MWh | 3 | *2 | ||
| Heat (steam, hot water, cold water) | Per unit of heat used 0.053 t-CO2/GJ |
277 | GJ | 15 | *1 | ||
| Scope3 | Category1 Purchased products / services |
Products | Raw materials Basic unit of representative materials used for each representative item (18 categories) kg-CO2eq/kg |
Average weight by item | kg | 12,723 | *3 |
| Garment 0.969 kg-CO2/piece |
2,665,473 | piece | 2,583 | *4 (25.5kg×0.038) |
|||
| Other than products | Per-unit consumption by category for purchased goods and services is used. t-CO2/M yen | Non-disclosure | M yen | 14,363 | *2 *3 | ||
| Category2 Capital goods |
Capital investment amount | Per capital good price 2.924 t-CO2eq/M yen |
1,538 | M yen | 4,497 | *2 | |
| Category3 Fuel and energy activities other than Scope 1.2 |
Electric power | Per energy volume 0.068 kg-CO2eq/kWh |
3,531 | MWh | 241 | *2 | |
| Gasoline | Per fuel use 0.557 kg-CO2eq/l |
2 | kl | 1 | *3 | ||
| City gas | Per fuel use 0.518 t-CO2eq/K Nm3 |
123 | K Nm3 | 64 | *3 | ||
| LPG | Per fuel use 0.839 t-CO2eq/t |
24 | t | 20 | *3 | ||
| Kerosene | Per fuel use 0.328 t-CO2eq/kl |
0 | kl | 0 | *3 | ||
| Heat (steam, hot water, cold water) | Per fuel use 0.033 t-CO2eq/GJ |
277 | GJ | 9 | *2 | ||
| Category4 Transportation and delivery (upstream) |
Product transportation | Per number [of clothing] 0.0003 t-CO2/piece |
2,689,115 | piece | 754 | *4 (25.5kg×0.011) |
|
| Category5 Wastes from business offices |
General garbage (incinerated) | Per waste weight 1.336 t-CO2/t |
3 | t | 4 | *2 *3 | |
| Paper wastes (incinerated) | Per waste weight 0.191 t-CO2/t |
28 | t | 5 | *2 *3 | ||
| Paper wastes (recycled) | Per waste weight 0.021 t-CO2/t |
19 | t | 0 | *2 | ||
| Glass (recycled) | Per waste weight 0.010 t-CO2/t |
0 | t | 0 | *2 | ||
| Metal (recycled) | Per waste weight 0.009 t-CO2/t |
7 | t | 0 | *2 | ||
| Plastic (recycled) | Per waste weight 0.149 t-CO2/t |
7 | t | 1 | *2 | ||
| Other (recycled) | Per waste weight 0.149 t-CO2/t |
38 | t | 6 | *2 | ||
| Category6 Business trip |
Number of employees | Per employee 0.130 t-CO2/person/year |
2,494 | person | 325 | *2 | |
| Category7 Employer's commute |
Commuter traffic expenses | Per allowance amount for transportation 1.854 t-CO2/M yen |
530 | M yen | 982 | *2 | |
| Category8 Leased assets (upstream) |
Included in Scope 1.2 | ||||||
| Category9 Transportation and delivery (downstream) |
Not included in this calculation | ||||||
| Category10 Processing of sold products |
Not included in this calculation | ||||||
| Category11 Use of sold products |
Not included in this calculation | ||||||
| Category12 Disposal of sold products |
Product disposal | Per weight 0.313 t-CO2e/t |
984 | t | 308 | *2 | |
| Category13 Leased assets (downstream) |
Not included in this calculation | ||||||
| Category14 Franchise |
Not included in this calculation | ||||||
| Category15 Investment |
Investment | Calculated from the percentage of shares held by Scope1.2 of companies in which we hold shares | 1,410 | ||||
| Supply Chain Emissions | 39,942 t-CO2 | ||||||
- Ministry of the Environment's Greenhouse Gas Emissions Calculation, Reporting, and Publication System
- Per unit emissions data base (Ver.3.6) for calculating GHG emissions, etc. for the organization through the supply chain
- LCI database IDEA v2 (for calculating supply chain GHG emissions)
- Survey Work on Fashion and Environment, Fiscal 2020, Ministry of the Environment: Results of the Fashion and Environment Survey: Prepared by the Japan Research Institute, Ltd.
"CO2 emissions throughout the lifecycle of clothing supplied domestically are estimated to be 25.5 kilograms per clothing unit produced."
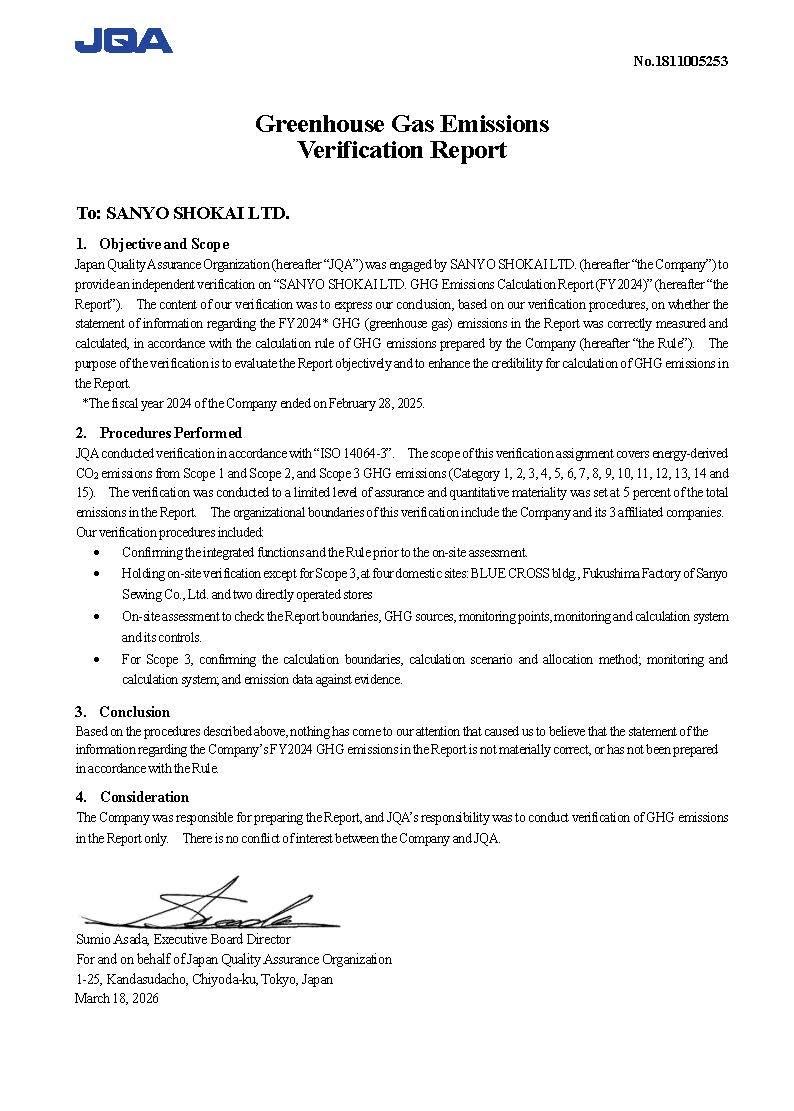
Obtaining a third-party verification report on GHG emissions in fiscal 2024
In order to improve the reliability of our emissions data for fiscal 2024 Scope1 2 and 3 (including consolidated and non-consolidated subsidiaries), we asked the Japan Quality Assurance Organization (JQA) to conduct a third-party verification and obtained a verification report. This verification was conducted in accordance with ISO14064-3, a global standard.
We will continue to promote activities aimed at achieving our GHG emissions reduction targets, monitor quantitative information, and disclose information in a highly transparent manner.